 BBC
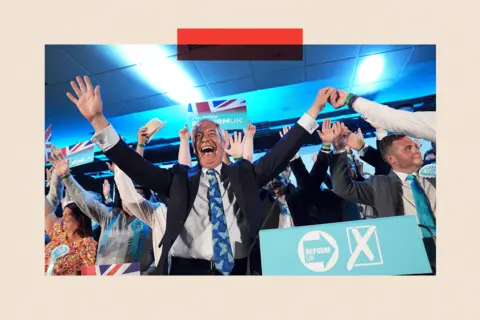
BBCThere is no doubt that Reform performed well in Thursday's local council elections. The party won most votes, most seats and overall control of most councils.
True, the party's share of the votes cast across all 23 councils where elections took place on Thursday was no more than 31%. So despite doing well, it secured far from a majority of those voting.
However, its performance was enough to put Reform well ahead of the Conservatives – who traditionally dominate county councils - on 23%, the Liberal Democrats on 17% and Labour on 14% when you tally up the votes in those parts of England that went to the polls on Thursday.
At the 2024 general election Reform secured 14% of the vote but just 5 out of 650 seats at Westminster. But crucially, being ahead of everyone else in 2025 ensured the first past the post-election system helped Reform.
Its tally of 677 council seats represented 41% of all those being contested on Thursday, ten points above its share of the vote, a nod to both the nature of the voting system and Reform's ability to cluster votes. That boost helped the party win control of as many as 10 councils, something that Reform's predecessor, Ukip, never managed at the height of its popularity in the run up to the 2015 general election.
In Staffordshire, Reform won 72% of the seats on 41% of the vote. In Kent, 37% of the vote delivered it 70% of the seats, while in Derbyshire the same share was rewarded with 66% of all the councillors.
Instead of insulating Conservative and Labour from the impact of a third-party challenge, as it has done so often before, first-past-the-post exacerbated their losses. In both cases Reform took nearly half of all the seats those parties were defending.
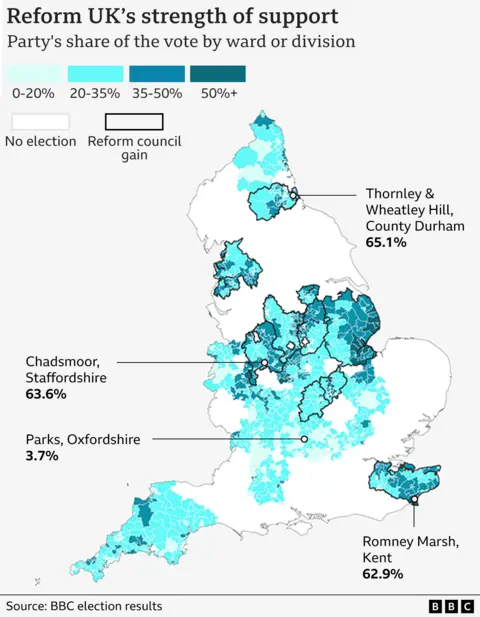
The map above is the most detailed local election mapping ever produced by the BBC. It details the strength of the Reform vote in every ward that voted on Thursday and shows support for Reform varied considerably.
That variation has some striking and important features. They suggest the party was particularly popular among those who voted for Brexit in 2016 and for Boris Johnson in 2019 - and that Reform's success cannot simply be dismissed as a short-lived protest vote.
Reflecting the party's anti-EU stance, Reform did much better in wards that voted heavily for Leave in the 2016 EU referendum than it did in wards that backed Remain.
In wards where more than 65% voted Leave in 2016, Reform won on average as much as 45% of the vote. In contrast, in places where a majority backed Remain, only 19% voted for Reform.
Although talked about much less by politicians nowadays, Brexit is still an important fault line in our politics. Reform's appeal is significantly concentrated among those who believe the Brexit decision was right.
Even so, the fact that even in pro-Remain wards the party was able to win as much as a fifth of the vote was testimony to the scale of the swing that it enjoyed on Thursday.
 PA Media
The Brexit division is also evident in the demographic character of the places where Reform did best and those where it did less well.
University graduates and those in professional and managerial jobs were least likely to vote for Brexit in 2016. Reform found it more difficult to do well in places where they are most numerous.
Reform won 39% of the vote in heavily working-class wards but only 19% in the most middle-class ones.
The map shows Reform's highest vote of all (65.1%) was in Thornley & Wheatley Hill, situated in Tony Blair's former Sedgefield constituency in Durham and once a centre of coal mining. Next highest was Chadsmoor in Staffordshire and Romney Marsh in Kent.
 PA Media
Meanwhile, support for the party averaged 43% in wards where more than half of adults have few, if any, educational qualifications. In contrast, it polled just 19% where more than two in five have a degree.
Reform's lowest share of the vote, 3.7%, was in the Parks ward in Oxford, situated in the heart of the famous university city.
Immigration is also a key issue for Reform. However, this perhaps makes the party less appealing to those from a minority background.
Certainly, on average the party only polled 22% in wards where more than one in five identify as other than 'white', compared with a tally of 33% in places where more than 95% told the 2021 Census that they were 'white'.
In summary, Reform did best in what has sometimes been characterised in the wake of the Brexit referendum as 'left-behind' Britain – places that have profited less from globalisation and university expansion and where a more conservative outlook on immigration is more common.
Neither the Conservatives nor Labour are likely to recover from the drubbing they received on Thursday unless they can appeal more to this slice of Britain.
Although polls indicate that Reform finds it easier to win over former Conservative voters than their Labour counterparts, Reform's average share of the vote was strikingly just as high in wards that Labour were defending as it was in places that the Conservatives were trying to retain.
The party on average won 32% of the vote in previously Labour wards and 32% in Conservative ones.
 Reuters
As a result, Labour lost seats to Reform at much the same rate as the Conservatives, a pattern that cost Labour control of the one council they were defending, Doncaster.
In contrast, Reform's advance was more muted in wards that the Liberal Democrats and the Greens were defending. The party's average share in these wards was just 22%. As a result, Reform had relatively little success in taking seats from these two parties.
Liberal Democrat and Green wards – unlike many Conservative and Labour ones - are heavily populated by university graduates.
Reform's success on Thursday undoubtedly reflects the mood of an electorate that still has little faith in the Conservatives and which now is disappointed by Labour's performance in office.
However, it is evidently proving most popular in a very distinctive part of Britain that overturned the political tables a decade ago in voting for Brexit - and which now has done so again.
John Curtice is Professor of Politics, University of Strathclyde, and Senior Fellow, National Centre for Social Research and 'The UK in a Changing Europe'.
Analysis by Patrick English, Steve Fisher, Robert Ford, and Lotte Hargrave
Map produced by Libby Rogers, Muskeen Liddar, Jess Carr and Callum Thomson.
BBC InDepth is the home on the website and app for the best analysis, with fresh perspectives that challenge assumptions and deep reporting on the biggest issues of the day. And we showcase thought-provoking content from across BBC Sounds and iPlayer too. You can send us your feedback on the InDepth section by clicking on the button below.